


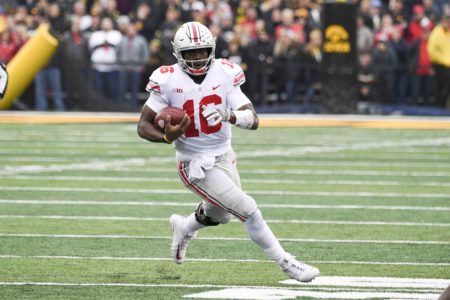
[Every now and again, longtime poster NEWBrutus will drop something on our Legacy Forum that we want to put up on the Front Page. This is one of those things. A number of pieces have already been written this week about the lack of touches for the running backs and the large number of carries for J.T. Barrett. The assertion being that too many carries for Barrett and too few carries for J.K. Dobbins is a bad thing. What do the numbers have to say, however? You might be surprised. — Tony Gerdeman]
Here are the game-by-game numbers for Dobbins, J.T. Barrett, and Mike Weber.
| Row Labels | Sum of Play_NoPlay | Sum of Play_Yards | Sum of YPP | Sum of Success Rate |
| J.K. |
Dobbins | |||
| Indiana | 29 | 181 | 6.24 | 48.3% |
| Oklahoma | 13 | 72 | 5.54 | 53.8% |
| Army | 13 | 172 | 13.23 | 84.6% |
| UNLV | 14 | 95 | 6.79 | 57.1% |
| Rutgers | 6 | 53 | 8.83 | 16.7% |
| Maryland | 13 | 96 | 7.38 | 76.9% |
| Nebraska | 12 | 106 | 8.83 | 66.7% |
| Penn State | 13 | 88 | 6.77 | 61.5% |
| Iowa | 6 | 51 | 8.50 | 33.3% |
| Total | 119 | 914 | 7.68 | 58.0% |
| J.T. | Barrett | (Sacks | Excluded) | |
| Indiana | 12 | 68 | 5.67 | 58.3% |
| Oklahoma | 15 | 81 | 5.40 | 46.7% |
| Army | 5 | 41 | 8.20 | 100.0% |
| UNLV | 4 | 22 | 5.50 | 75.0% |
| Rutgers | 7 | 88 | 12.57 | 71.4% |
| Maryland | 8 | 59 | 7.38 | 62.5% |
| Nebraska | 9 | 55 | 6.11 | 77.8% |
| Penn State | 15 | 106 | 7.07 | 46.7% |
| Iowa | 13 | 72 | 5.54 | 76.9% |
| Total | 88 | 592 | 6.73 | 63.6% |
| Mike |
Weber | |||
| Oklahoma | 3 | 29 | 9.67 | 100.0% |
| Army | 4 | 13 | 3.25 | 50.0% |
| Rutgers | 10 | 44 | 4.40 | 70.0% |
| Maryland | 13 | 59 | 4.54 | 69.2% |
| Nebraska | 18 | 82 | 4.56 | 55.6% |
| Penn State | 7 | 21 | 3.00 | 57.1% |
| Iowa | 5 | 27 | 5.40 | 100.0% |
| Total | 60 | 275 | 4.58 | 66.7% |
Certainly the thing that jumps off the page is Dobbins’ average per carry. He’s a special back. You can easily make an argument for why he should get the ball more. Your eyes tell you that too.
But let’s look at J.T.’s numbers for a moment–taking sacks out of the equation. Barrett is an effective runner and more importantly an efficient runner.
Defenses are forcing him to keep the ball in the read game (per Kevin Wilson), but he makes his carries count. For the season 63.6% of his carries are successful plays (gains 5 yards on first down, 70% of the yards on second down, and converts 3rd and 4th downs).
Too often this gets lost in the shuffle.
Consider what happened vs. Iowa in the running game. Dobbins had an impressive 8.5 yard per carry average. That number is largely skewed by one run of 35 yards. He averaged 3 yards per carry on his other attempts.
J.T. averaged a solid 5.54 yards per carry, and was successful 77% of the time.
People are arguing that the lack of touches for the running backs were the problem against Iowa. The numbers say otherwise.
In fact, our average yards per carry against Iowa were better than what we did against Penn State!
The stronger argument is that we should have run the ball more period, regardless of who was getting the carries.