


[Editor’s note: NEWBrutus is a long-time poster on our forum who has contributed statistical breakdowns for us in the past. Up today is a look back at what went right, wrong, and indifferent against TCU.]
The Buckeyes faced a strong opponent in TCU and received their first real test of the season. Reading the box score, the two teams were pretty even statistically, except for one key area. The thing which jumps off the page was TCU’s three turnovers. But when we dig deeper, things were not as even as they seemed.
Ohio State Offense
| Play Type | Plays | Pct | Yards | YPP | Success Rate |
| PASS | 39 | 47.56% | 343 | 8.79 | .564 |
| RUN | 43 | 52.44% | 193 | 4.49 | .535 |
| Grand Total | 82 | 100.00% | 536 | 6.54 | .549 |
TCU Offense
| Play Type | Plays | PCT | Yards | YPP | Success
Rate |
| PASS | 43 | 56.58% | 284 | 6.60 | .419 |
| RUN | 33 | 43.42% | 227 | 6.88 | .515 |
| Grand Total | 76 | 100.0% | 511 | 6.72 | .461 |
Note: Sacks are included in the pass plays.
Ohio State was balanced, and as expected leaned more heavily on the running game. But the thing which jumps out of the table above is the level of success we had against a very good passing defense. (More on that later.)
Despite a slight Horned Frog advantage in Yards Per Play (YPP), the success rates of each offense were noticeably different. The other thing which is interesting, TCU had two more offensive drives and still ran 6 fewer plays than Ohio State. Defensive TD’s are a nice thing to help your cause, but it does take away opportunities for your offense.
There was one thing which stuck out to me in watching the game both live and then for a second time on Sunday. The Ohio State defense improved noticeably in the second half. The numbers show this as well.
Here are TCU’s offensive stats by half.
First Half
| Play Type | Plays | PCT | Yards | YPP | Success Rate |
| PASS | 20 | 52.63% | 122 | 6.10 | .500 |
| RUN | 18 | 47.37% | 167 | 9.28 | .667 |
| Grand Total | 38 | 100.0% | 289 | 7.61 | .579 |
Second Half
| Play Type | Plays | PCT | Yards | YPP | Success Rate |
| PASS | 23 | 60.53% | 162 | 7.04 | .348 |
| RUN | 15 | 39.47% | 60 | 4.00 | .333 |
| Grand Total | 38 | 100.0% | 222 | 5.84 | .342 |
And though allowing 5.8 yards per play is nothing to be happy about, it represents a 23% improvement over the first half. The more important thing was the defense, despite allowing a few chunk plays in the second half, limited the Frogs success, even without the best player in college football.
Drive Stats
Here are the drive statistics for each team.
| Team | Drives | Avg Start | TDs | FGA | FGM | Off. Pts | Pts/ Dr | Dr Eff. | Sc. Chance | SC Eff. | Pts/SC |
| OSU | 12 | 62.6 | 3 | 3 | 2 | 26 | 2.17 | .310 | 6 | .476 | 3.33 |
| TCU | 14 | 81.1 | 4 | 1 | 0 | 28 | 2.00 | .286 | 4 | .500 | 3.50 |
Ohio State had a significant advantage in field position, but give some credit to the TCU defense. Ohio State did not do much with their drives. They only scored 31% of the available points. And despite getting six scoring chances (defined as a first down inside of the opponents 40 yard line), Ohio State only managed to score 20 points on those six trips.
But also give the Ohio State defense credit. TCU was only able to score 28.6% of their available points (drives multiplied by 7). And they only had four scoring chances and were limited to 14 points on those trips. It wasn’t a perfect, or even a great outing by any stretch, but TCU had trouble consistently converting their possessions into points. (Oregon State had a better drive efficiency and points per drive numbers than TCU. Chew on that!)
Who Got The Ball?
It is always interesting to me to see who is making plays for the Buckeye Offense.
Here is the breakdown of the chances from the TCU game. (A chance is a carry, a target or a catch…Think of it as who was supposed to have the ball in their hands when the whistle blew).
| Position Group | Chances | Pct of Chances | Yards | Pct of Yds | YPP |
| H | 10 | 12.50% | 155 | 29.47% | 15.50 |
| QB | 3 | 3.75% | 8 | 1.52% | 2.67 |
| RB | 41 | 51.25% | 216 | 41.06% | 5.27 |
| WR | 23 | 28.75% | 152 | 28.90% | 6.61 |
| TEAM | 3 | 3.75% | -5 | -0.95% | -1.67 |
| Grand Total | 80 | 100.00% | 526 | 100.00% | 6.58 |
Here are the stats from the passing game
| Pos/Player | Catches | Targets | Catch Rate | Yards | YPC |
| WR | 11 | 21 | 52% | 152 | 7.24 |
| 1 Dixon | 4 | 6 | 67% | 39 | 6.50 |
| 9 Victor | 0 | 1 | 0% | 0 | 0.00 |
| 11 Mack | 4 | 9 | 44% | 84 | 9.33 |
| 83 McClauren | 3 | 5 | 60% | 29 | 5.80 |
| H | 8 | 9 | 89% | 161 | 17.89 |
| 14 Hill | 6 | 6 | 100% | 95 | 15.83 |
| 21 Campbell | 2 | 3 | 67% | 66 | 22.00 |
| RB | 5 | 5 | 100% | 31 | 6.20 |
| 2 Dobbins | 1 | 1 | 100% | 3 | 3.00 |
| 25 Weber | 4 | 4 | 100% | 28 | 7.00 |
| TE | 0 | 2 | 0% | 0 | 0.00 |
| 13 Berry | 0 | 2 | 0% | 0 | 0.00 |
| TEAM | 0 | 1 | 0% | 0 | 0.00 |
| 99 | 0 | 1 | 0% | 0 | 0.00 |
| Grand Total | 24 | 38 | 63% | 344 | 9.05 |
And from the running game (Sacks not included)
| Row Labels | Plays | Yards | YPP | TD | Succ Rate |
| H | 1 | -6 | -6.00 | 0 | .000 |
| 21 Campbell | 1 | -6 | -6.00 | 0 | .000 |
| QB | 2 | 9 | 4.50 | 1 | .500 |
| 7 Haskins | 2 | 9 | 4.50 | 1 | .500 |
| RB | 36 | 185 | 5.14 | 0 | .528 |
| 2 Dobbins | 19 | 122 | 6.42 | 0 | .579 |
| 25 Weber | 17 | 63 | 3.71 | 0 | .471 |
| TEAM | 2 | -5 | -2.50 | 0 | .500 |
| 99 Team | 2 | -5 | -2.50 | 0 | .500 |
| Grand Total | 41 | 183 | 4.46 | 1 | .512 |
It is a diversified attack. Lots of the skill players are touching the football. It is hard to key in on one receiver. It is apparent though that Austin Mack and KJ Hill are favorite targets as they lead the team in that category.
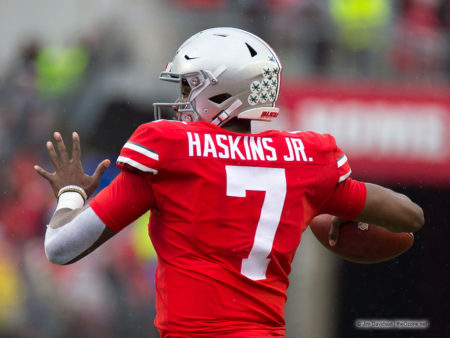
How Special is Haskins?
The numbers speak for themselves. He passes the eye test, too. He is accurate and effective.
| Row Labels | Comp. | Att. | Yards | Pct | TD | Int | Pass Eff |
| Dwayne Haskins | 66 | 91 | 890 | 72.5% | 11 | 1 | 192.37 |
| Vs Or.St. | 22 | 30 | 313 | 73.3% | 5 | 1 | 209.31 |
| Vs Rutgers | 20 | 23 | 233 | 87.0% | 4 | 0 | 229.44 |
| @TCU | 24 | 38 | 344 | 63.2% | 2 | 0 | 156.57 |
Now consider against TCU, there were at least 3 drops (maybe 4) and 6 passes defended. TCU’s pass defense looked very good on Saturday. He easily could have completed 73% of his passes for nearly 400 yards had the drops not happened. And had the TCU DB’s not been up to snuff, the numbers could have easily been video game like.
By the way. The single season passing records look like this:
Pass efficiency: 169.8 – JT Barrett – 2014
Completion Pct: 65.3% – Troy Smith – 2006
TD Passes: 35 JT Barrett – 2017
Passing Yards: 3,330 Joe Germaine 1998
All of those are in danger just a quarter of the way into the season.