


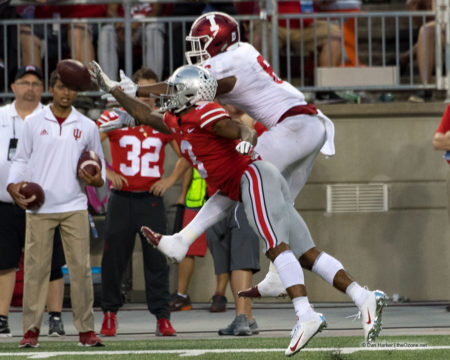
[Editor’s note: NEWBrutus is a long-time poster on our forum who has contributed statistical breakdowns for us in the past. Up today is a look back at what went right, wrong, and indifferent against Indiana.]
Like many, I found it frustrating to watch the Indiana game in real time. After the fact, the numbers can show whether those real time feelings were justified or maybe a bit overstated. In the case of playing the Hoosiers, it was a little of both.
Drive Efficiency
The job of your offense is to score. The job of your defense is to prevent a score. And one way to measure that is through a metric called drive efficiency. You take the number of drives a team has (eliminating the ones where there are simply one or two plays in victory formation to run out the clock) and multiply by 7. Those are the possible points. You simply divide the offensive points scored by the possible points to obtain your drive efficiency.
This table compares the Buckeyes and the Hoosiers.
| Team | Drives | Avg Start | TDs | FGA | FGM | Off. Pts | Pts/Dr | Dr Eff. | Sc. Chance | SC Eff. | Pts/SC |
| OSU | 14 | 68.5 | 7 | 0 | 0 | 49 | 3.50 | .500 | 8 | .750 | 5.25 |
| Indiana | 14 | 67.9 | 3 | 3 | 2 | 26 | 1.86 | .265 | 8 | .464 | 3.25 |
Each team had 14 drives and the starting field position was very similar.
The good: Ohio State scored TDs on 50% of their offensive drives against a team with a decent defense. The Buckeye defense held the Hoosiers to a drive efficiency of .265.
The not so good: Indiana had 8 scoring chances. (A scoring chance is a possession with a first down inside your opponents 40 yard line.) This was the largest number of scoring chances for any Ohio State opponent all year (Penn State had 7).
The “Okay”: The Buckeye defense kept the Hoosiers from capitalizing on most of their opportunities while doing well with their own.
At the half-way point for the season, our opponents have a drive efficiency of .214, which isn’t awful. A year ago, through the first six games, opponent scoring efficiency was .165.
The pace of play this year is also impacting the defensive numbers. Through the first six games in 2017, our opponents averaged 12.5 drives per game and 1.16 points per drive. This year, our opponents are averaging 13.3 drives per game and 1.86 points per drive.
Breaking down the Play-by-Play Data
The Buckeyes struggled to run the football well enough to meet the fans’ and coaches’ expectations, but they are throwing it at a very high level. Indiana didn’t have much of a running game on Saturday but was able to throw it effectively. Let’s look at the numbers.
The Ohio State Offense
| Ohio State | Plays | Yds | YPP | Succ Rate | XPL Plays | XPL Yds | Xpl Pct. |
| 1st Down | 43 | 306 | 7.1 | .651 | 6 | 148 | .484 |
| PASS | 19 | 213 | 11.2 | .895 | 5 | 127 | .596 |
| RUN | 24 | 93 | 3.9 | .458 | 1 | 21 | .226 |
| 2nd Down | 29 | 142 | 4.9 | .414 | 1 | 22 | .155 |
| PASS | 16 | 103 | 6.4 | .375 | 1 | 22 | .214 |
| RUN | 13 | 39 | 3.0 | .462 | 0 | 0 | .000 |
| 3rd Down | 16 | 150 | 9.4 | .500 | 2 | 88 | .587 |
| PASS | 10 | 131 | 13.1 | .600 | 2 | 88 | .672 |
| RUN | 6 | 19 | 3.2 | .333 | 0 | 0 | .000 |
| 4th Down | 4 | 11 | 2.8 | .750 | 0 | 0 | .000 |
| RUN | 4 | 11 | 2.8 | .750 | 0 | 0 | .000 |
| Grand Total | 92 | 609 | 6.6 | .554 | 9 | 258 | .424 |
Note: Sacks are included in pass plays
The numbers confirm what our eyes saw. We struggled to run the football effectively against the Hoosier defense, and at times it seemed like we stubbornly insisted on trying when other things were working far better.
As I was watching the game, and they kept talking about Haskins’ amazing numbers, I started thinking we must be throwing it far more than we were running it. That wasn’t the case at all. It turns out we ran 92 plays, which is the high for the season. In all, our Run/Pass Ratio was nearly equal.
| Indiana | Plays | Yds | YPP | Succ. Rate | XPL Plays | XPL Yds | XPL Pct |
| 1st Down | 33 | 270 | 8.2 | .576 | 6 | 161 | .596 |
| PASS | 25 | 239 | 9.6 | .640 | 6 | 161 | .674 |
| RUN | 8 | 31 | 3.9 | .375 | 0 | 0 | .000 |
| 2nd Down | 20 | 98 | 4.9 | .250 | 3 | 81 | .827 |
| PASS | 14 | 42 | 3.0 | .214 | 2 | 36 | .857 |
| RUN | 6 | 56 | 9.3 | .333 | 1 | 45 | .804 |
| 3rd Down | 14 | 36 | 2.6 | .286 | 0 | 0 | .000 |
| PASS | 12 | 30 | 2.5 | .333 | 0 | 0 | .000 |
| RUN | 2 | 6 | 3.0 | .000 | 0 | 0 | .000 |
| 4th Down | 3 | 2 | 0.7 | .333 | 0 | 0 | .000 |
| PASS | 1 | 0 | 0.0 | .000 | 0 | 0 | |
| RUN | 2 | 2 | 1.0 | .500 | 0 | 0 | .000 |
| Grand Total | 70 | 406 | 5.8 | .414 | 9 | 242 | .596 |
The explosive plays continue to be a noticeable issue. And while I share that concern, the bigger problem in my view was that Indiana had far too much success on first down. When you are averaging 8.2 yards per play on first down and gaining five or more with regularity, it puts your defense in a bind on later downs.
Indiana did not have much of a running game. Outside of one big hit for 45 yards, the Hoosiers were ineffective running the football. They averaged less than 3 yards per carry on their other 17 attempts (excluding the three sacks).
About those explosive plays….
This continues to be an ongoing problem for the Ohio State defense. It is hard not to notice when your opponent gains big chunks at a time. It tends to overshadow how good the defense can be as well.
Here is a breakdown for each game.
| Game | Plays | Yards | YPP | Succ Rate |
| Oregon State | 63 | 392 | 6.2 | .302 |
| Non-Explosive | 56 | 76 | 1.4 | .214 |
| Explosive | 7 | 316 | 45.1 | 1.000 |
| Rutgers | 61 | 133 | 2.2 | .246 |
| Non-Explosive | 59 | 103 | 1.7 | .237 |
| Explosive | 2 | 30 | 15.0 | .500 |
| TCU | 76 | 511 | 6.7 | .461 |
| Non-Explosive | 67 | 201 | 3.0 | .388 |
| Explosive | 9 | 310 | 34.4 | 1.000 |
| Tulane | 58 | 256 | 4.4 | .345 |
| Non-Explosive | 53 | 107 | 2.0 | .283 |
| Explosive | 5 | 149 | 29.8 | 1.000 |
| Penn St. | 76 | 492 | 6.5 | .303 |
| Non-Explosive | 66 | 156 | 2.4 | .197 |
| Explosive | 10 | 336 | 33.6 | 1.000 |
| Indiana | 70 | 406 | 5.8 | .414 |
| Non-Explosive | 61 | 164 | 2.7 | .328 |
| Explosive | 9 | 242 | 26.9 | 1.000 |
| Grand Total | 404 | 2190 | 5.4 | .349 |
There is not a lot of middle ground here. Right now, one out of every nine opponent snaps are gaining 15 yards or more. The more alarming thing is the average yards per play for those big gainers. Those explosive plays are averaging 32.6 yards each time they happen. They have also accounted for nearly two-thirds of the total yards allowed in 2018.
Why the explosive plays matter.
Explosive plays lead directly to points. Here is a breakdown of opponent drives with at least one explosive play compared to drives without an explosive play.
Drives with at least one play of 15 or more yards…
| Game | Drives | TDs | FGM | FGA | Points |
| Oregon State | 5 | 4 | 0 | 0 | 28 |
| Rutgers | 2 | 0 | 1 | 1 | 3 |
| TCU | 7 | 4 | 0 | 1 | 28 |
| Tulane | 4 | 1 | 0 | 0 | 6 |
| Penn State | 8 | 3 | 1 | 2 | 23 |
| Indiana | 5 | 3 | 2 | 2 | 26 |
| Grand Total | 31 | 15 | 4 | 6 | 114 |
Drives with no plays of 15 or more yards….
| Game | Drives | TDs | FGM | FGA | Points |
| Oregon St. | 9 | 0 | 1 | 2 | 3 |
| Rutgers | 10 | 0 | 0 | 0 | 0 |
| TCU | 7 | 0 | 0 | 0 | 0 |
| Tulane | 5 | 0 | 0 | 0 | 0 |
| Penn State | 9 | 0 | 1 | 1 | 3 |
| Indiana | 9 | 0 | 0 | 1 | 0 |
| Grand Total | 49 | 0 | 2 | 4 | 6 |
When our opponents have those big plays, they are converting them into points. In fact 114 of the 120 points allowed by our defense came on drives where the explosive plays happened.
Interestingly enough, the defense is otherwise very stout, allowing just 2.2 yards per play and an opponent success rate of .276. The potential to be a championship level defense is there.
Attribute this however you want (bad angles, missed assignments, etc) but it is happening far too often
Who is Getting The Ball
Tony and the Ozone Staff have already covered the record-setting performance of Dwayne Haskins in the passing game, so I won’t repeat it here. Instead, we will skip to how the ball is being distributed.
For the Indiana Game – when you run 92 plays, there is plenty of love to go around!
Chances are targets and carries, basically who had the ball or where the ball was going when the whistle blew.
| Position/Player | Chances | Pct of Chances | Yards | Pct of Yds | YPP |
| H | 18 | 19.57% | 188 | 30.87% | 10.44 |
| 14 – Hill | 7 | 7.61% | 46 | 7.55% | 6.57 |
| 21 – Campbell | 11 | 11.96% | 142 | 23.32% | 12.91 |
| QB | 7 | 7.61% | 7 | 1.15% | 1.00 |
| 7 – Haskins | 7 | 7.61% | 7 | 1.15% | 1.00 |
| RB | 44 | 47.83% | 182 | 29.89% | 4.14 |
| 2 – Dobbins | 30 | 32.61% | 107 | 17.57% | 3.57 |
| 25 – Weber | 14 | 15.22% | 75 | 12.32% | 5.36 |
| TE | 1 | 1.09% | 13 | 2.13% | 13.00 |
| 89 – Farell | 1 | 1.09% | 13 | 2.13% | 13.00 |
| WR | 19 | 20.65% | 224 | 36.78% | 11.79 |
| 1 – Dixon | 5 | 5.43% | 73 | 11.99% | 14.60 |
| 9 – Victor | 4 | 4.35% | 43 | 7.06% | 10.75 |
| 11 – Mack | 6 | 6.52% | 49 | 8.05% | 8.17 |
| 83 – McClaurin | 4 | 4.35% | 59 | 9.69% | 14.75 |
| TEAM | 3 | 3.26% | -5 | -0.82% | -1.67 |
| Grand Total | 92 | 100.00% | 609 | 100.00% | 6.62 |
For The Season
| Position/Player | Chances | Pct of Chances | Yards | Pct of Yds | YPP |
| H | 95 | 19.63% | 956 | 28.17% | 10.06 |
| 14 – Hill | 37 | 7.64% | 361 | 10.64% | 9.76 |
| 21 – Campbell | 48 | 9.92% | 512 | 15.09% | 10.67 |
| 26 – Gill | 1 | 0.21% | 11 | 0.32% | 11.00 |
| 30 – McCall | 9 | 1.86% | 72 | 2.12% | 8.00 |
| QB | 39 | 8.06% | 164 | 4.83% | 4.21 |
| 7 – Haskins | 21 | 4.34% | 43 | 1.27% | 2.05 |
| 18 – Martell | 18 | 3.72% | 121 | 3.57% | 6.72 |
| RB | 224 | 46.28% | 1201 | 35.39% | 5.36 |
| 2 – Dobbins | 113 | 23.35% | 588 | 17.32% | 5.20 |
| 6 – Snead | 11 | 2.27% | 37 | 1.09% | 3.36 |
| 25 – Weber | 83 | 17.15% | 470 | 13.85% | 5.66 |
| 33 – Teague | 17 | 3.51% | 106 | 3.12% | 6.24 |
| TE | 10 | 2.07% | 51 | 1.50% | 5.10 |
| 13 – Berry | 5 | 1.03% | 6 | 0.18% | 1.20 |
| 88 – Ruckert | 2 | 0.41% | 13 | 0.38% | 6.50 |
| 89 – Farrell | 3 | 0.62% | 32 | 0.94% | 10.67 |
| WR | 99 | 20.45% | 1047 | 30.85% | 10.58 |
| 1 – Dixon | 17 | 3.51% | 218 | 6.42% | 12.82 |
| 9 – Victor | 14 | 2.89% | 169 | 4.98% | 12.07 |
| 11 – Mack | 35 | 7.23% | 279 | 8.22% | 7.97 |
| 15 – Harris | 3 | 0.62% | 22 | 0.65% | 7.33 |
| 19 – Olave | 2 | 0.41% | 19 | 0.56% | 9.50 |
| 80 – Saunders | 9 | 1.86% | 50 | 1.47% | 5.56 |
| 82 – Prater | 1 | 0.21% | 13 | 0.38% | 13.00 |
| 83 – McClaurin | 18 | 3.72% | 277 | 8.16% | 15.39 |
| TEAM | 17 | 3.51% | -25 | -0.74% | -1.47 |
| Grand Total | 484 | 100.00% | 3394 | 100.00% | 7.01 |
Here is where things get interesting. Fans are clamoring for a better running game. And we will need to be able to run the football better as the season progresses. But you also must consider this: when you force the running game, you take the ball out of the hands of other playmakers and a quarterback who has been very efficient at distributing the ball to them. J.K. Dobbins and Mike Weber are very good, but the numbers say we should be doing even more to get the ball to guys like Campbell, Dixon, Victor, and McClaurin.
Do you stubbornly try to force the running game at the expense of limiting the chances for the other playmakers on the team? (Especially when the opponents are doing everything they can to stop our running game!)