


[Editor’s note: NEWBrutus is a long-time poster on our forum who has contributed statistical breakdowns for us in the past. Up today is a look back at what went right, wrong, and indifferent against Michigan State.]
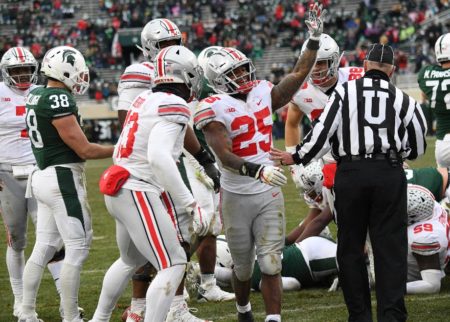
Ohio State and Michigan State squared off on a cold and windy day this past Saturday.
Michigan State featured the nation’s top rush defense, allowing 2.52 yards per carry. Only Penn State and the team up north had rushed for more than 100 yards against the Spartans this season.
Coming into the weekend, the Spartan offense was also less than impressive. They averaged 3.47 yards per carry on the ground and ranked 119th in pass efficiency offense.
The Buckeyes entered the contest looking for continued improvement in their running game and on the defensive side of the football.
Let’s take a look at the numbers.
Drive Based Data
| Offense | Drives | Avg Start | TDs | FGA | FGM | Off. Pts | Pts/ Dr | Dr Eff. | Sc. Chance | SC Eff. | Pts/SC |
| Ohio State | 14 | 58.1 | 1 | 2 | 1 | 17 | 1.21 | .173 | 6 | .405 | 2.83 |
| MSU | 16 | 80.9 | 0 | 3 | 2 | 6 | 0.38 | .054 | 4 | .214 | 1.50 |
Ohio State held a decisive advantage in starting field position. The success in the punting game was largely responsible for that. All of MSU’s second half drives following a punt began inside their own 10-yard line. Those Spartan drives ended in a punt, a made field goal, a punt, a safety and a fumble (recovered for a TD by Dre’Mont Jones). Our opponent’s starting field position was a significant factor in the outcome of this game.
The Buckeye defense, as we will discuss shortly, played very well. The marks for points per drive allowed and drive efficiency (offensive points divided by possible points) were the best since playing hapless Rutgers earlier in the year.
However, the Ohio State offense continued to struggle with finishing drives. The Buckeyes had six scoring chances (a possession with at least one first down inside the opponent’s 40-yard line). Three of those resulted in points. The others resulted in a punt, a missed field goal and a turnover.
Failing to capitalize on those opportunities is frustrating and may be a problem later in the season.
Offensive Stats
| Plays | Yards | YPP | Succ Rate | XPL | XPL Yds | XPL Yds Pct | |
| Ohio State | 84 | 347 | 4.13 | .393 | 7 | 128 | .369 |
| PASS | 41 | 216 | 5.27 | .390 | 6 | 110 | .509 |
| RUN | 43 | 131 | 3.05 | .395 | 1 | 18 | .137 |
| MSU | 66 | 274 | 4.15 | .227 | 7 | 157 | .573 |
| PASS | 48 | 220 | 4.58 | .250 | 6 | 110 | .500 |
| RUN | 18 | 54 | 3.00 | .167 | 1 | 47 | .870 |
Sack yards are included in the passing totals
The Ohio State defense was outstanding. They limited the yards per play allowed, and it was the second best mark this season (Rutgers had 2.2 ypp). And our opponent’s success rate was the lowest for the year.
They limited the explosive plays—plays which gain 15+ yards—especially in the running game. Without the 47-yard quarterback run, the Spartan running game was non-existent.
Entering the game, the Spartans were not good by any measure. But that shouldn’t stop us from giving credit where it is due. This was an outstanding and dominating performance by the Ohio State defense in almost any way you look at it.
It should also be noted, there were no penalties accepted (or called) against the Ohio State defense as well.
The Ohio State offense faced a really good defense and turned in a fairly mediocre performance. Self-inflicted wounds consisting of dropped passes, untimely penalties, and a turnover left their mark on this performance. The 4.1 yards per play was our worst mark this season. The pass efficiency rating of 118.89 was the worst of the season as well.
If you told me before the game that we would be successful running the ball nearly 40% of the time against the defense we faced, I probably would have laughed. In some ways the running game took another step forward. But it is also difficult to get excited about a sack adjusted 3 yards per carry. There are some things happening in our run game which leave me scratching my head.
A Look at Third Downs
A lot has been made of Ohio State’s seemingly lack of ability to convert third-and-short opportunities this season. Here is a look at our third down opportunities, by distance, for the season.
3rd and Short (3 yards or fewer) converting nearly 74%
3rd and Medium (4-6 yards) converting nearly 48%
3rd and long (7-10 yards) converting nearly 35%
3rd and very long (11+ yard) converting nearly 16%
Third-and-short has not been as bad as it seems even without the QB run threat.
Unfortunately, against the Spartans, third down was less successful. We were 3 for 5 on third-and-short, 3 for 5 on third-and-medium, and 0 for 8 on third downs of 7+ yards to go.
The Playmakers
| Chances | Pct of Chances | Yards | Pct of Yds | YPP | |
| H | 15 | 17.86% | 89 | 25.65% | 5.93 |
| Hill | 7 | 8.33% | 38 | 10.95% | 5.43 |
| Campbell | 8 | 9.52% | 51 | 14.70% | 6.38 |
| QB | 4 | 4.76% | -6 | -1.73% | -1.50 |
| Haskins | 3 | 3.57% | -11 | -3.17% | -3.67 |
| Martell | 1 | 1.19% | 5 | 1.44% | 5.00 |
| RB | 39 | 46.43% | 139 | 40.06% | 3.56 |
| Dobbins | 16 | 19.05% | 37 | 10.66% | 2.31 |
| Weber | 23 | 27.38% | 102 | 29.39% | 4.43 |
| TE | 5 | 5.95% | 36 | 10.37% | 7.20 |
| Berry | 2 | 2.38% | 26 | 7.49% | 13.00 |
| Farrell | 3 | 3.57% | 10 | 2.88% | 3.33 |
| WR | 18 | 21.43% | 104 | 29.97% | 5.78 |
| Dixon | 5 | 5.95% | 0 | 0.00% | 0.00 |
| Victor | 2 | 2.38% | 0 | 0.00% | 0.00 |
| McLaurin | 8 | 9.52% | 63 | 18.16% | 7.88 |
| Olave | 3 | 3.57% | 41 | 11.82% | 13.67 |
| TEAM | 3 | 3.57% | -15 | -4.32% | -5.00 |
| Grand Total | 84 | 100.00% | 347 | 100.00% | 4.13 |
This game saw the first real impact of Chris Olave. Mike Weber had an outstanding game, as did Terry McClaurin, Parris Campbell, and K.J. Hill. And while this was the first appearance of a Tate Martell “package,” it was used on a limited basis.
At the end of the game, I felt as if the defense took a critical step forward, and I think we saw continued steps in the right direction for the running game as well. But like many, I don’t think the Buckeyes are where they need to be in a lot of areas.
On to Maryland with another chance to improve.