


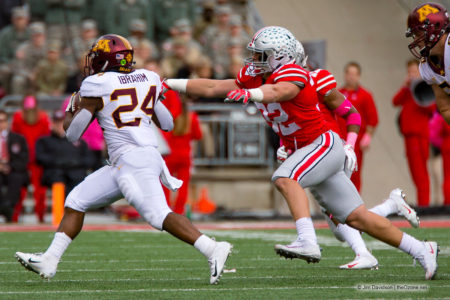
[Editor’s note: NEWBrutus is a long-time poster on our forum who has contributed statistical breakdowns for us in the past. Up today is a look back at what went right, wrong, and indifferent against Minnesota.]
Jim Tressel used to say things are never as good or as bad as they look. They are usually somewhere in between. In many respects, the same can be said for Ohio State’s efforts on both sides of the ball against Minnesota.
Explosive Woes Continue
Each team had 10 possessions in this game and Minnesota was able to continually gain chunks of yardage at a time. These chunk plays, which go for 15 yards or more, were prevalent on 70% of the Gopher possessions. This was the highest number for any team facing the Buckeyes so far this year. That is the bad, and frankly it is very concerning.
On those 7 drives, the Gophers were able to score two TDs and miss two field goals. Their other three drives resulted in no scoring attempts.
| Drives without Explosive Pays | Drives with Explosive Plays | ||||||||||||
| Opp. | Drives | TDs | FGM | FGA | Pts. | Drives | TDs | FGM | FGA | PTs | |||
| Or. St. | 9 | 0 | 1 | 2 | 3 | 5 | 4 | 0 | 0 | 28 | |||
| Rutgers | 10 | 0 | 0 | 0 | 0 | 2 | 0 | 1 | 1 | 3 | |||
| TCU | 7 | 0 | 0 | 0 | 0 | 7 | 4 | 0 | 1 | 28 | |||
| Tulane | 5 | 0 | 0 | 0 | 0 | 4 | 1 | 0 | 0 | 6 | |||
| PSU | 9 | 0 | 1 | 1 | 3 | 8 | 3 | 1 | 2 | 23 | |||
| Indiana | 9 | 0 | 0 | 1 | 0 | 5 | 3 | 2 | 2 | 26 | |||
| Minn. | 3 | 0 | 0 | 0 | 0 | 7 | 2 | 0 | 2 | 14 | |||
| Grand Total | 52 | 0 | 2 | 4 | 6 | 38 | 17 | 4 | 8 | 128 | |||
Some other things about the explosive plays:
- Minnesota ran 56 plays, 9 of which (16.1%) went for 15 yards or more. This is the highest percentage allowed this season.
- Minnesota gained 220 of their 388 yards on those 9 plays. The 56.7% of yards gained on the explosive plays is the second lowest by an Ohio State opponent this year (Rutgers had 22.6%).
- The 388 yards gained by the gophers is the second lowest total of the season (Rutgers gained 133).
- 56 Plays were the fewest run by an Ohio State opponent this year.
An Ugly Offensive Day
While there is a lot of concern about the Ohio State defense, they are not the reason this game was as ugly as it was.
| Offense | Drives | Avg Start | TDs | FGA | FGM | Off. Pts | Pts/Dr | Dr Eff. | Sc. Chance | SC Eff. | Pts/SC |
| Ohio State | 10 | 76.5 | 3 | 3 | 3 | 30 | 3.00 | .429 | 6 | .548 | 3.83 |
| Minnesota | 10 | 77.2 | 2 | 2 | 0 | 14 | 1.40 | .200 | 5 | .400 | 2.80 |
The Ohio State defense limited the damage. The 1.4 points per possession is below our season average, the .200 drive efficiency is also below our season average.
But there is more to the story.
| Plays | Yards | YPP | Success Rate | |
| Ohio St. | 76 | 504 | 6.63 | .342 |
| PASS | 47 | 393 | 8.36 | .426 |
| RUN | 29 | 111 | 3.83 | .207 |
| Minnesota | 56 | 388 | 6.93 | .357 |
| PASS | 25 | 201 | 8.04 | .440 |
| RUN | 31 | 187 | 6.03 | .290 |
(Please note, sacks are included in the passing totals, not the rushing totals)
Although Minnesota’s yards per play was the most allowed so far in 2018, their success rate was not a reason for alarm.
In some respects The Ohio State offense significantly underperformed on Saturday. The running game was abysmal (and that is probably being nice). A 20.7% success rate is even more alarming than the 3.83 yards per carry (adjusted for sacks). The 42.6% success rate when throwing the ball for 400 yards is also poor. The defense did a reasonable job of limiting the Gophers’ success, but Ohio State’s offense performed worse.
We had six scoring chances (a scoring chance is defined as a possession with a first down inside your opponent’s 40-yard line), kicked three field goals and turned the ball over on downs once. Prior to Saturday we had a scoring chance efficiency of .773 and were scoring 5.41 points for each opportunity. On Saturday we had a scoring chance efficiency of .548 and only scored 3.83 points for each time.
Minnesota’s defense came into the game with a top 25 defense, so they deserve some credit for the lack of success. However, the problems with the running game stick out like a sore thumb.
A deeper look at the running game
Adjusting for sacks, the Buckeyes ran the ball 29 times for 111 yards. That is 3.83 yards per attempt. This is as bad as it looks. Quite frankly, the last three games have been awful by Ohio State’s standards.
| Game | Att | Yds | YPA | Succ Rate | Stuff | Stuff Rate | XPL | XPL Yds | Neg Plays |
| Or. State | 53 | 375 | 7.08 | .642 | 6 | .113 | 6 | 157 | 2 |
| Rutgers | 38 | 234 | 6.16 | .553 | 10 | .263 | 4 | 115 | 3 |
| TCU | 41 | 183 | 4.46 | .512 | 19 | .463 | 3 | 52 | 8 |
| Tulane | 35 | 162 | 4.63 | .486 | 8 | .229 | 2 | 34 | 2 |
| Penn State | 36 | 121 | 3.36 | .361 | 14 | .389 | 1 | 18 | 8 |
| Indiana | 47 | 162 | 3.45 | .468 | 19 | .404 | 1 | 21 | 4 |
| Minnesota | 29 | 111 | 3.83 | .207 | 10 | .345 | 0 | 0 | 4 |
| Grand Total | 279 | 1348 | 4.83 | .480 | 86 | .308 | 17 | 397 | 31 |
In the last three games we have faced decent defenses. The results are concerning. The first thing which sticks out is a lack of explosive plays in the running game. In the past three weeks the Buckeyes have had 2 running plays gain more than 15 yards. Without those, the rushing numbers will not look impressive.
Equally concerning is the stuff rate. A “stuff” is a carry which goes for one or fewer yards. While the stuff rate against Minnesota wasn’t as bad as it was against Indiana or Penn State, it is still concerning.
The most alarming thing, which was mentioned earlier, is the poor success rate running the football. Even against Indiana we had some success running the ball, we just didn’t have the big gainers to improve the average. Against Minnesota, we struggled to have any success.
Whether it is blocking, scheme, facing loaded boxes, etc., there are glaring problems which need to be fixed before the weather becomes a major factor later in the fall.
If this game ended up 45 to 14, opinions and feelings are probably going to be much different. The defensive effort wasn’t nearly as bad as it looked live. (It wasn’t great either.) But we made plays (three turnovers) and Minnesota shot themselves in the foot once or twice too. After the Gophers’ two scoring drives early in the game, they were kept off the scoreboard, and we further limited their success.
The struggles on offense, even with another 400-yard passing day, made it look a lot worse than it was. The offense should have scored 45 points, but they didn’t. And despite video game like numbers from Haskins, there were issues with finishing drives. The lack of success running the football amplifies this even more.
Who is Getting the Ball
One of the more impressive things about Dwayne Haskins is how well he distributes the ball to multiple targets. The tight ends were involved more this week than they had been in prior weeks. And what can you say about KJ Hill?
| Chances | Pct of Chances | Yards | Pct of Yds | YPP | |
| H | 21 | 27.63% | 243 | 48.21% | 11.57 |
| 14 – Hill | 10 | 13.16% | 187 | 37.10% | 18.70 |
| 21 – Campbell | 11 | 14.47% | 56 | 11.11% | 5.09 |
| QB | 9 | 11.84% | 6 | 1.19% | 0.67 |
| 7 – Haskins | 9 | 11.84% | 6 | 1.19% | 0.67 |
| RB | 27 | 35.53% | 93 | 18.45% | 3.44 |
| 2 – Dobbins | 13 | 17.11% | 40 | 7.94% | 3.08 |
| 25 – Weber | 14 | 18.42% | 53 | 10.52% | 3.79 |
| TE | 4 | 5.26% | 57 | 11.31% | 14.25 |
| 13 – Berry | 2 | 2.63% | 20 | 3.97% | 10.00 |
| 89 – Farrell | 2 | 2.63% | 37 | 7.34% | 18.50 |
| WR | 15 | 19.74% | 105 | 20.83% | 7.00 |
| 1 – Dixon | 3 | 3.95% | 8 | 1.59% | 2.67 |
| 9 – Victor | 1 | 1.32% | 0 | 0.00% | 0.00 |
| 11 – Mack | 5 | 6.58% | 28 | 5.56% | 5.60 |
| 80 – Saunders | 3 | 3.95% | 14 | 2.78% | 4.67 |
| 83 – McLaurin | 3 | 3.95% | 55 | 10.91% | 18.33 |
| Grand Total | 76 | 100.00% | 504 | 100.00% | 6.63 |
(Chances are targets plus carries)
For the season, the numbers look like this:
| Chances | Pct of Chances | Yards | Pct of Yds | YPP | |
| H | 116 | 20.71% | 1199 | 30.76% | 10.34 |
| 14 – Hill | 47 | 8.39% | 548 | 14.06% | 11.66 |
| 21 – Campbell | 59 | 10.54% | 568 | 14.57% | 9.63 |
| 26 – Gill | 1 | 0.18% | 11 | 0.28% | 11.00 |
| 30 – McCall | 9 | 1.61% | 72 | 1.85% | 8.00 |
| QB | 48 | 8.57% | 170 | 4.36% | 3.54 |
| 7 – Haskins | 30 | 5.36% | 49 | 1.26% | 1.63 |
| 18 – Martell | 18 | 3.21% | 121 | 3.10% | 6.72 |
| RB | 251 | 44.82% | 1294 | 33.20% | 5.16 |
| 2 – Dobbins | 126 | 22.50% | 628 | 16.11% | 4.98 |
| 6 – Snead | 11 | 1.96% | 37 | 0.95% | 3.36 |
| 25 – Weber | 97 | 17.32% | 523 | 13.42% | 5.39 |
| 33 – Teague | 17 | 3.04% | 106 | 2.72% | 6.24 |
| TE | 14 | 2.50% | 108 | 2.77% | 7.71 |
| 13 – Berry | 7 | 1.25% | 26 | 0.67% | 3.71 |
| 88 – Ruckert | 2 | 0.36% | 13 | 0.33% | 6.50 |
| 89 – Farrell | 5 | 0.89% | 69 | 1.77% | 13.80 |
| WR | 114 | 20.36% | 1152 | 29.55% | 10.11 |
| 1 – Dixon | 20 | 3.57% | 226 | 5.80% | 11.30 |
| 9 – Victor | 15 | 2.68% | 169 | 4.34% | 11.27 |
| 11 – Mack | 40 | 7.14% | 307 | 7.88% | 7.68 |
| 15 – Harris | 3 | 0.54% | 22 | 0.56% | 7.33 |
| 19 – Olave | 2 | 0.36% | 19 | 0.49% | 9.50 |
| 80 – Saunders | 12 | 2.14% | 64 | 1.64% | 5.33 |
| 82 – Prater | 1 | 0.18% | 13 | 0.33% | 13.00 |
| 83 – McLaurin | 21 | 3.75% | 332 | 8.52% | 15.81 |
| TEAM | 17 | 3.04% | -25 | -0.64% | -1.47 |
| Grand Total | 560 | 100.00% | 3898 | 100.00% | 6.96 |
The good news is the Buckeyes are 7-0 with a good chance to be 8-0 before they have a weekend off. The open date comes at a good time this year to help players get healthy again.