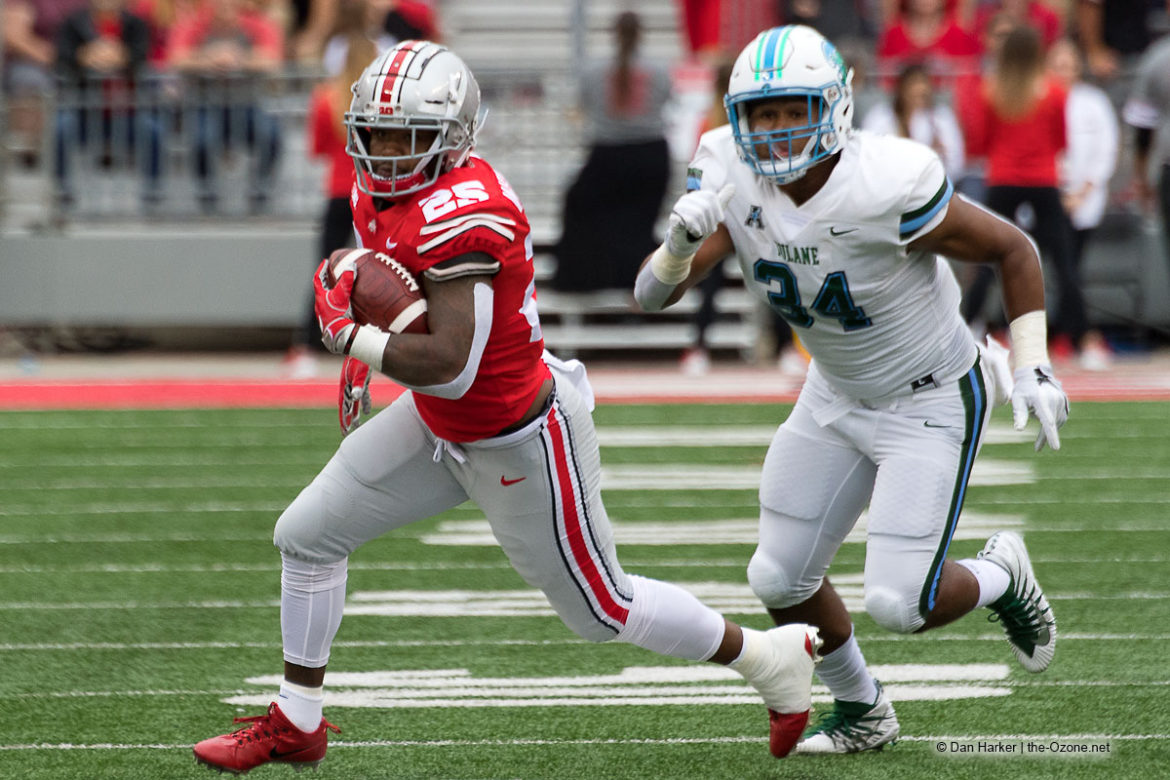
[Editor’s note: NEWBrutus is a long-time poster on our forum who has contributed statistical breakdowns for us in the past. Up today is a look back at what went right, wrong, and indifferent against Tulane.]
Ohio State’s outing on Saturday was a tale of two halves. In the first half, it was a display of offensive efficiency and precision. In the second half, it was, as Urban Meyer has been known to say, a clown show. Defensively speaking, it was a strong outing by the Buckeyes throughout the game.
Let’s look at some numbers.
First, the First Half for the Ohio State offense.
| Ohio State | Plays | Yards | YPP | Success Rate |
| Down | 47 | 425 | 9.0 | .681 |
| 1 | 26 | 177 | 6.8 | .577 |
| 2 | 16 | 212 | 13.3 | .813 |
| 3 | 4 | 27 | 6.8 | .750 |
| 4 | 1 | 9 | 9.0 | 1.000 |
| Grand Total | 47 | 425 | 9.0 | .681 |
And the second half:
| Ohio State | Plays | Yards | YPP | Success Rate |
| Down | 29 | 145 | 5.0 | .379 |
| 1 | 12 | 60 | 5.0 | .417 |
| 2 | 9 | 35 | 3.9 | .333 |
| 3 | 6 | 38 | 6.3 | .333 |
| 4 | 2 | 12 | 6.0 | .500 |
| Grand Total | 29 | 145 | 5.0 | .379 |
Quite a difference in the first half performance and the second half performance. Some drop off is expected, but the backups had performed far better against Rutgers and Oregon State than they did against Tulane.
The Ohio State defense did pretty well against a unique offensive style.
| Tulane | Plays | Yards | YPP | Success Rate |
| Down | 58 | 256 | 4.4 | .345 |
| 1 | 25 | 137 | 5.5 | .360 |
| 2 | 20 | 81 | 4.1 | .350 |
| 3 | 12 | 33 | 2.8 | .333 |
| 4 | 1 | 5 | 5.0 | .000 |
| Grand Total | 58 | 256 | 4.4 | .345 |
The 34.5% success rate is right at the defense’s season average and the 4.4 yards per play allowed is slightly below the season average (5.0) allowed.
In all Ohio State’s starters played a half of football. This could have been a game for video game-like numbers, but there was no point in placing players at risk when a tough trip to Penn State looms on the horizon.
Drive-Based Data
The drive-based data shows an equally dominant day for the Buckeyes.
| Offense | Drives | Avg Start | TDs | FGA | FGM | Off. Pts | Pts/Dr | Dr Eff. | Sc. Chance | SC Eff. | Pts/SC |
| OSU | 10 | 70.1 | 7 | 0 | 0 | 49 | 4.90 | .700 | 8 | .875 | 6.13 |
| Tulane | 9 | 80.7 | 1 | 0 | 0 | 6 | 0.67 | .095 | 3 | .286 | 2.00 |
Ohio State scored on all but one scoring chance. They turned it over on downs. They also had a significant advantage in starting field position.
Who is Getting The Ball?
It seems like each week there is a different player who has a massive day. This week it was Parris Campbell’s turn, and this was basically in one half of football.
| Position | Chances | Pct of Chances | Yards | Pct of Yds | YPP |
| H | 21 | 27.63% | 277 | 48.60% | 13.19 |
| QB | 11 | 14.47% | 27 | 4.74% | 2.45 |
| RB | 26 | 34.21% | 126 | 22.11% | 4.85 |
| TE | 1 | 1.32% | 0 | 0.00% | 0.00 |
| WR | 17 | 22.37% | 140 | 24.56% | 8.24 |
| Grand Total | 76 | 100.00% | 570 | 100.00% | 7.50 |
Tate Martell adds the dimension of the QB run back into the offense. That’s why the quarterback played a bigger role in the offense last week. Haskins did have two scrambles and a sack to his credit. Martell was sacked twice and had 6 other carries.
Through four games, the opportunities on offense look like this.
| Player | Chances | Pct of Chances | Yards | Pct of Yds | YPP |
| H | 58 | 18.35% | 633 | 26.42% | 10.91 |
| Hill, KJ | 22 | 37.93% | 259 | 40.92% | 11.77 |
| Campbell | 26 | 44.83% | 291 | 45.97% | 11.19 |
| Gill | 1 | 1.72% | 11 | 1.74% | 11.00 |
| McCall | 9 | 15.52% | 72 | 11.37% | 8.00 |
| QB | 28 | 8.86% | 149 | 6.22% | 5.32 |
| Haskins | 10 | 35.71% | 28 | 18.79% | 2.80 |
| Martell | 18 | 64.29% | 121 | 81.21% | 6.72 |
| RB | 150 | 47.47% | 845 | 35.27% | 5.63 |
| Dobbins | 64 | 42.67% | 363 | 42.96% | 5.67 |
| Snead | 11 | 7.33% | 37 | 4.38% | 3.36 |
| Weber | 58 | 38.67% | 339 | 40.12% | 5.84 |
| Teague | 17 | 11.33% | 106 | 12.54% | 6.24 |
| TE | 8 | 2.53% | 38 | 1.59% | 4.75 |
| Berry | 4 | 50.00% | 6 | 15.79% | 1.50 |
| Ruckert | 2 | 25.00% | 13 | 34.21% | 6.50 |
| Farrell | 2 | 25.00% | 19 | 50.00% | 9.50 |
| WR | 66 | 20.89% | 738 | 30.80% | 11.18 |
| Dixon | 12 | 18.18% | 145 | 19.65% | 12.08 |
| Victor | 8 | 12.12% | 71 | 9.62% | 8.88 |
| Mack | 22 | 33.33% | 205 | 27.78% | 9.32 |
| Harris | 3 | 4.55% | 22 | 2.98% | 7.33 |
| Olave | 2 | 3.03% | 19 | 2.57% | 9.50 |
| Saunders | 7 | 10.61% | 45 | 6.10% | 6.43 |
| Prater | 1 | 1.52% | 13 | 1.76% | 13.00 |
| McClaurin | 11 | 16.67% | 218 | 29.54% | 19.82 |
| TEAM | 6 | 1.90% | -7 | -0.29% | -1.17 |
| Team | 6 | 100.00% | -7 | 100.00% | -1.17 |
| Grand Total | 316 | 100.00% | 2396 | 100.00% | 7.58 |
Campbell’s big day gave him the “lead” in the WR room for number of chances.
The Assualt on the Record Books Continues
Dwayne Haskins continues his scorching-hot start. And if he continues at a similar pace, he won’t just pencil his name into the single season marks, he will annihilate many of those good marks.
Here are his stats through four games.
| Comp. | Att. | Yards | Pct | TD | Int | Pass Eff | |
| Totals | 87 | 115 | 1194 | 75.7% | 16 | 1 | 207.04 |
| Oregon St. | 22 | 30 | 313 | 73.3% | 5 | 1 | 209.31 |
| Rutgers | 20 | 23 | 233 | 87.0% | 4 | 0 | 229.44 |
| TCU | 24 | 38 | 344 | 63.2% | 2 | 0 | 156.57 |
| Tulane | 21 | 24 | 304 | 87.5% | 5 | 0 | 262.65 |
If he averages about 28 attempts per game for the remainder of the season, here is how this may project through the regular season (12 games)
261-345 3,582 yards, 48 TD’s 3 Interceptions.
Add the possibility of 3 additional post season games and Haskins could easily eclipse the 4,000-yard mark and more than 50 TD passes. He is the most exciting passing quarterback I’ve ever seen wearing Scarlet and Gray. It will be very interesting to see what happens this coming Saturday at Penn State.


