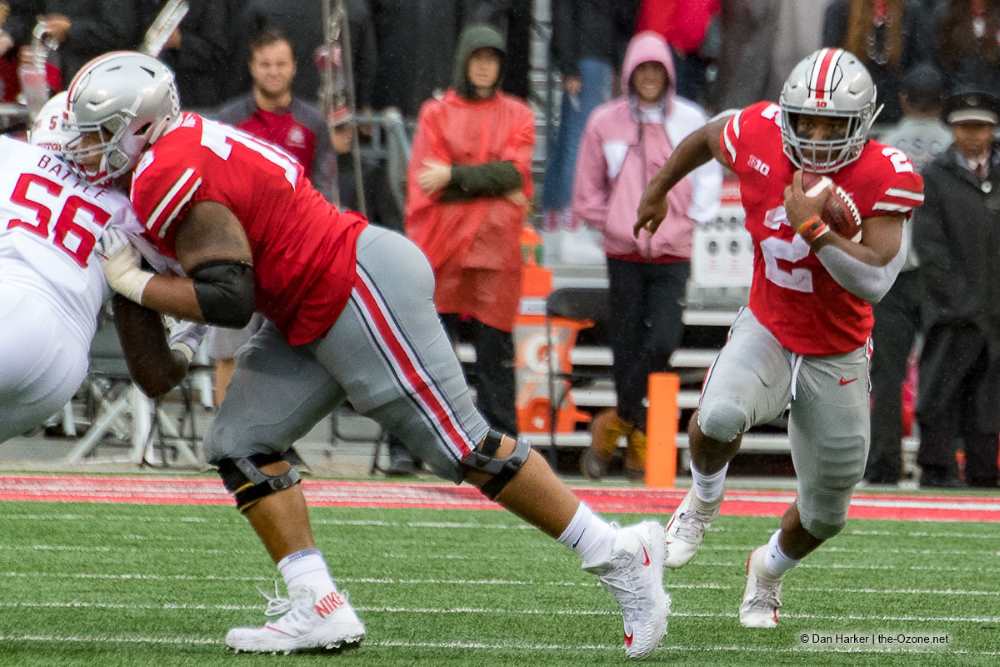
[Editor’s note: NEWBrutus is a long-time poster on our forum who has contributed statistical breakdowns for us in the past. We thought that might not happen this year due to Ohio State’s new website, but thanks to a strong community, NEWBrutus is back with tons of data telling you just how well this Ohio State offense is doing so far after two games.]
(Because of the assistance of two fellow Ozone forum posters, the play-by-play data has been formatted in a way which can be used to crunch the data. Without the help of Randy and Frank this would not have been possible.)
We have seen two full games of some offensive firepower. Granted both happened at the expense of two pretty bad football teams, but it was still impressive. In both outings we have seen an efficient offense with big play potential and it has put up seemingly video game-like numbers.
Let’s take a look at the numbers for the Ohio State offense through the first two games.
Success Rate
(Success rate is defined as a first down play which gains 50% of the needed yards to reach the next set of downs, i.e. a 5-yard gain or better on 1st and 10; a second down play which gains 70% of the needed yards; and a third or fourth down play which results in a first down.)
The numbers for the first two games look like this.
| Down | Plays | Yards | YPP | Success Rate |
| Oregon St | 87 | 721 | 8.3 | .644 |
| 1 | 43 | 385 | 9.0 | .605 |
| 2 | 28 | 200 | 7.1 | .607 |
| 3 | 15 | 103 | 6.9 | .800 |
| 4 | 1 | 33 | 33.0 | 1.000 |
| Rutgers | 73 | 579 | 7.9 | .630 |
| 1 | 36 | 296 | 8.2 | .639 |
| 2 | 23 | 167 | 7.3 | .609 |
| 3 | 14 | 116 | 8.3 | .643 |
| Grand Total | 160 | 1300 | 8.1 | .638 |
| Down | Plays | Yards | YPP | Success Rate |
| 1 | 79 | 681 | 8.6 | .620 |
| 2 | 51 | 367 | 7.2 | .608 |
| 3 | 29 | 219 | 7.6 | .724 |
| 4 | 1 | 33 | 33.0 | 1.000 |
| Grand Total | 160 | 1300 | 8.1 | .638 |
Being successful on first and second down makes third down conversions much easier, and it allows the offense to sustain drives. When over 60% of your first down plays result in gains of 5 yards or more, it leads to good things.
But how good are these numbers? In the 2017 season, Ohio State’s offense had a success rate of 53.5% on first down, 55.8% on second down, 50.5% on third down, and 48.5% on fourth down.
However if you isolate comparable opponents from the 2017 schedule to the first two opponents for this season, the numbers look significantly better. If you look at the success rates in the games against Army, UNLV and Rutgers, you see similar numbers to the current season. Against those three opponents, Ohio State had a success rate of 63.9% on first down, 55.5% on second down, 66.7% on third down, and 53.7% on fourth down. This year’s offense has performed slightly better against weaker competition compared to last year.
Run/Pass Mix
Maybe it is just me, but when watching the games it seemed like we were throwing the ball more than we have in prior years. But after looking at the numbers, I was surprised to see that may not be the case.
| Plays | Pct | Yards | YPP | Success Rate | |
| Or. State | |||||
| 1st Down | |||||
| PASS | 13 | 30.23% | 220 | 16.92 | .769 |
| RUN | 30 | 69.77% | 165 | 5.50 | .533 |
| 2nd Down | |||||
| PASS | 13 | 46.43% | 62 | 4.77 | .462 |
| RUN | 15 | 53.57% | 138 | 9.20 | .733 |
| 3rd Down | |||||
| PASS | 8 | 53.33% | 64 | 8.00 | .750 |
| RUN | 7 | 46.67% | 39 | 5.57 | .857 |
| 4th Down | |||||
| RUN | 1 | 100.00% | 33 | 33.00 | 1.000 |
| Rutgers | |||||
| 1st Down | |||||
| PASS | 16 | 44.44% | 173 | 10.81 | .813 |
| RUN | 20 | 55.56% | 123 | 6.15 | .500 |
| 2nd Down | |||||
| PASS | 11 | 47.83% | 81 | 7.36 | .636 |
| RUN | 12 | 52.17% | 86 | 7.17 | .583 |
| 3rd Down | |||||
| PASS | 8 | 57.14% | 91 | 11.38 | .625 |
| RUN | 6 | 42.86% | 25 | 4.17 | .667 |
Here is what the totals looked like in 2017
| Row Labels | Plays | Run/Pass Pct | Yards | Yds/Play | Success Rate |
| 1 | |||||
| PASS | 203 | 41.86% | 1662 | 8.19 | 54.2% |
| RUN | 282 | 58.14% | 1784 | 6.33 | 52.1% |
| 2 | |||||
| PASS | 147 | 42.86% | 1196 | 8.14 | 48.3% |
| RUN | 196 | 57.14% | 1188 | 6.06 | 56.1% |
| 3 | |||||
| PASS | 104 | 54.17% | 649 | 6.24 | 36.5% |
| RUN | 88 | 45.83% | 571 | 6.49 | 59.1% |
| 4 | |||||
| PASS | 8 | 36.36% | 41 | 5.13 | 37.5% |
| RUN | 14 | 63.64% | 64 | 4.57 | 85.7% |
But here is where things are interesting. Last season, against Army, UNLV, and Rutgers we were far more pass heavy than we have been in our first two games this season. We basically used two of those games to specifically working on the passing game. Here is the break down for those three games last year.
| Row Labels | Plays | Run/Pass Pct | Yards | Yds/Play | Success Rate |
| 1 | |||||
| PASS | 64 | 57.14% | 577 | 9.02 | 65.6% |
| RUN | 48 | 42.86% | 386 | 8.04 | 56.3% |
| 2 | |||||
| PASS | 31 | 41.89% | 321 | 10.35 | 51.6% |
| RUN | 43 | 58.11% | 343 | 7.98 | 74.4% |
| 3 | |||||
| PASS | 20 | 64.52% | 193 | 9.65 | 40.0% |
| RUN | 11 | 35.48% | 46 | 4.18 | 45.5% |
| 4 | |||||
| PASS | 4 | 66.67% | 15 | 3.75 | 50.0% |
| RUN | 2 | 33.33% | 3 | 1.50 | 100.0% |
Something in these numbers jumps off the page. Look at the success rate on the passing plays. It’s not just a little different when comparing similar competition levels. Perhaps the reason it seems like we have thrown it more is maybe because we have thrown it better.
Who is Getting The Ball?
One of the biggest questions I had coming into the season is who would get the ball. In the past few seasons, the quarterback accounted for about 20% of the total chances on offense (carries, targets, or catches), and J.T. Barrett and Braxton Miller were both excellent ball carriers. But this year is different. Haskins is not a running quarterback. Where would those chances go?
First, here are the 2017 numbers for all games.
| Position Group | Chances | Pct of Chances | Yards | Pct of Yards | YPP |
| RB | 399 | 38.8% | 2581 | 36.4% | 6.47 |
| QB | 193 | 18.8% | 879 | 12.4% | 4.55 |
| H | 177 | 17.2% | 1653 | 23.3% | 9.34 |
| WR | 171 | 16.6% | 1597 | 22.5% | 9.34 |
| TE | 59 | 5.7% | 428 | 6.0% | 7.25 |
| TEAM | 29 | 2.8% | -54 | -0.8% | -1.86 |
| Grand Total | 1028 | 100.0% | 7084 | 100.0% | 6.89 |
Here are the numbers for the first two games of 2018.
| Row Labels | Chances | Pct of Chances | Yards | Pct of Yds | YPP |
| H | 27 | 16.88% | 201 | 15.46% | 7.44 |
| QB | 14 | 8.75% | 114 | 8.77% | 8.14 |
| RB | 83 | 51.88% | 503 | 38.69% | 6.06 |
| TE | 3 | 1.88% | 32 | 2.46% | 10.67 |
| WR | 30 | 18.75% | 452 | 34.77% | 15.07 |
| TEAM | 3 | 1.88% | -2 | -0.15% | -0.67 |
| Grand Total | 160 | 100.00% | 1300 | 100.00% | 8.13 |
This was probably not unexpected.
Drive Based Data
Football comes down to what you do with your opportunities. You get a limited number of chances to score each game and the end goal for each possession is to score. A one-play, 75-yard touchdown drive is a better outcome than an 11-play 75-yard drive which results in a field goal. They still don’t award points for time of possession, after all.
Some definitions:
Drives: Number of Drives where the offense is actually trying to score. This excludes half ending drives with kneel downs or plays to purposely run out the clock.
Offensive points: Excludes defensive and special teams points.
Drive efficiency: Total points divided by possible points. (Possible points is drives x 7)
Scoring chances: A scoring chance is a drive where you have at least one first down play inside your opponent’s 40 yard line.
Scoring efficiency: Points scored divided by possible scoring chance points.
| Dr | TD | FGA | FGM | Off. Pts | Pts/ Dr | Dr Eff. | Sc. Chance | SC Eff. | Pts/ SC | |
| OrSt | 12 | 10 | 0 | 0 | 70 | 5.83 | .833 | 8 | .875 | 6.13 |
| Rut | 12 | 7 | 1 | 1 | 52 | 4.33 | .619 | 5 | .886 | 6.20 |
| 24 | 17 | 1 | 1 | 122 | 5.08 | .726 | 13 | .879 | 6.15 |
Two bad opponents, means your drive statistics look really good. There is an expectation for these numbers to see a significant decrease next Saturday.
So what do we know about the Ohio State offense after two weeks?
Not much. Two poor opponents lead to inflated offensive numbers. It is easy to get excited about what we have seen with our own eyes, but we should keep our expectations reasonable. We will face better competition in two of the next three weeks and both will be in more hostile environments. Posting similar numbers against TCU or Penn State is unlikely, but it would be fun if we did.


I know this is asking a lot but I wonder what the efficiency numbers looked like against Wisconsin, Alabama, and Oregon during the championship drive of 2014. I only ask because it seems that Haskins is more Car…Dale…Jones than Jay…Tee….Barrett (couldn’t help that). I think this offense can score against big time defenses when let loose (someone once said you play to win the game) – though neither RB as good as they are can be likened to Zeke. Not sure what it proves – but at least it gives me (perhaps us) and indication of what the scheme can actually do when let loose.