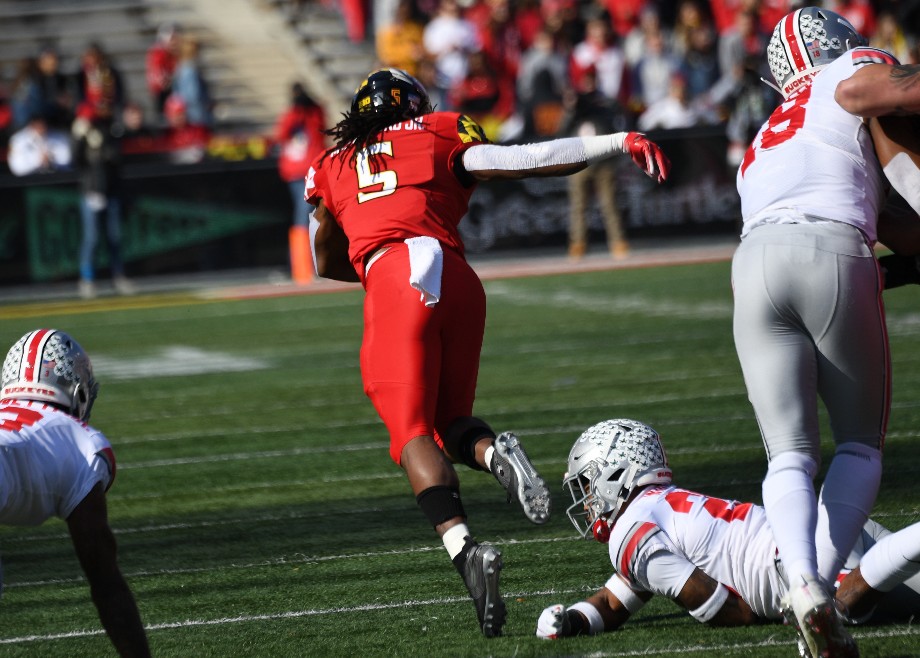
[Editor’s note: NEWBrutus is a long-time poster on our forum who has contributed statistical breakdowns for us in the past. Up today is a look back at what went right, wrong, and indifferent against Maryland.]
Many Ohio State fans were hoping to see continued improvement from both the Buckeye offense and defense when they traveled to College Park, Maryland to take on the Terps.
We were treated to a thrilling overtime victory, but one that left many Buckeye fans frustrated.
After sifting through the numbers, the best description I can come up with for both units is bi-polar.
At times, the signs of improvement were there. The numbers show there were times when both units were terrific, if not dominant.
Then there were periods of the game where both units were absolutely terrible.
Those terrible moments nearly cost us the game.
Let’s take a deeper dive.
Drive Data
| Drives | Avg Start | TDs | FGA | FGM | Off. Pts | Pts/Dr | Dr Eff. | Sc. Chance | SC Eff. | Pts/SC | |
| OSU | 14 | 68.9 | 7 | 1 | 1 | 52 | 3.71 | .531 | 9 | .714 | 5.00 |
| UMD | 14 | 72.0 | 6 | 2 | 1 | 44 | 3.14 | .449 | 8 | .536 | 3.75 |
Ohio State held a slight advantage in starting field position and drive efficiency. They also were able to convert more of their scoring opportunities into points.
The numbers say this was the best offensive performance since facing Indiana in week six of the season, but it was marred by three turnovers and a failed fourth-down conversion deep in plus territory. Two of the turnovers resulted in at least at 10-point swing, as losing a fumble inside the 5-yard line and the pick-6 happened on back-to-back offensive possessions.
Instead of potentially going to the locker room tied or only down four, we found ourselves down two touchdowns after our first possession of the second half. This could have been a devastating swing in momentum.
We survived, and eventually prevailed.
Offensive Stats
| Offense | Plays | Yards | YPP | Succ Rate | XPL | XPL Yds | XPL Yds Pct | |
| OSU | 94 | 688 | 7.32 | .585 | 11 | 315 | .458 | |
| PASS | 39 | 401 | 10.28 | .641 | 8 | 252 | .628 | |
| RUN | 55 | 287 | 5.22 | .545 | 3 | 63 | .220 | |
| UMD | 62 | 535 | 8.63 | .403 | 13 | 494 | .923 | |
| PASS | 18 | 164 | 9.11 | .333 | 5 | 188 | 1.146 | |
| RUN | 44 | 371 | 8.43 | .432 | 8 | 306 | .825 | |
So you’re reading this and thinking, “How can 114% of their yards in the passing game come from explosive plays?” Sacks are included in the passing stats and not the running stats. I had to go back and look again too.
Let’s start with the Ohio State defense.
When they were good, they were really good. When they were bad, they were really bad.
As has been the case in every game but two, explosive plays have been a major problem. Our opponents have feasted on our proclivity to allow big plays. Maryland was no different, as 92% of the Terrapin yards were gained on plays of 15 yards or more. This is a season high (Oregon State 80.6%).
But to be fair, there were times when the defense played really well. In fact most of the time they played really well. Maryland’s other 49 plays netted 41 total yards, less than one yard per play. Their success rate on those other 49 plays was 24.5%.
But the big plays happened. Whether it is due to missed assignments, running the wrong way, missing tackles, or bad scheme, you cannot overlook, ignore, or rationalize them away. They are part of the game and they have a significant impact on the outcome. There is no way to gloss over this and call it a good performance, or even an average performance.
On the offensive side of the ball, this was a quality performance marred by three key turnovers. The 58.5% success rate is the best since we faced Rutgers and Oregon State. And averaging 7.3 yards per play was the best mark since the first two weeks as well.
But like the defense, you just cannot overlook the critical turnovers (though for the life of me I cannot figure out why we called a QB draw, which ended up resulting in a fumble).
As mentioned earlier, the 10-14 point swing from those was significant and nearly cost us the game.
A Step Forward in the Running Game.
Today we introduce two new measures, Opportunity rate and stuff rate. Both are a way to measure of how well the offensive line is doing their job. Stuff rate is the percentage of running plays which result in zero or negative yards. Opportunity rate is the percentage of runs which gain at least four yards. The idea behind opportunity rate is the line is responsible for the first part of the run, anything after 4 yards is on the back and the downfield blocking of the receivers.
Note: Sacks are excluded from these totals.
| Game | Carries | Yards | YPP | Success Rate | Stuff Rate | Opp. Rt |
| Oregon State | 53 | 375 | 7.08 | .642 | .057 | .660 |
| Rutgers | 38 | 234 | 6.16 | .553 | .211 | .605 |
| @TCU | 41 | 183 | 4.46 | .512 | .268 | .488 |
| Tulane | 35 | 162 | 4.63 | .486 | .114 | .514 |
| @Penn State | 36 | 121 | 3.36 | .361 | .278 | .472 |
| Indiana | 47 | 162 | 3.45 | .468 | .277 | .383 |
| Minnesota | 29 | 111 | 3.83 | .207 | .241 | .483 |
| @Purdue | 24 | 78 | 3.25 | .333 | .167 | .375 |
| Nebraska | 39 | 239 | 6.13 | .538 | .154 | .564 |
| @Mich State | 43 | 131 | 3.05 | .395 | .326 | .419 |
| Maryland | 55 | 287 | 5.22 | .545 | .145 | .564 |
| Total | 440 | 2083 | 4.73 | .477 | .200 | .511 |
There were times on Saturday when it seemed like our renewed emphasis on running the football seemed to hold our offense back. The offensive staff was stubborn. As a fan there were times it was very frustrating, but for the most part it worked very well.
Our stuff rate was the lowest it had been in weeks (Tulane week 4). Our success rate was the best it had been since we played hapless Rutgers. And our opportunity rate was as good as it has been all season long.
The line performed well despite losing starting left tackle Thayer Munford. Dobbins ran extremely well. And the most interesting thing we saw in the run game was Dwayne Haskins pulling the ball on the inside zone reads and gaining positive yards with his feet. (Note he also had two scrambles, but the play-by -play data doesn’t identify scrambles).
Maryland is an above-average defense. Their defensive opportunity rate is 45.6%. Their stuff rate was 17.1%. Our offense was able to better those two categories. The test is much bigger next week, but there have been significant signs of improvement since the open week.
Passing Game Returns to Form.
The running game has shown steady improvement over the past few weeks, but it seemed to come at the expense of the passing game. Saturday, the passing game began to resemble what we saw earlier in the season.
| Game | Comp | Att | Yds | Pct | TD | Int | Pass Eff |
| Oregon State | 25 | 34 | 346 | 73.5% | 5 | 1 | 201.66 |
| Rutgers | 30 | 33 | 354 | 90.9% | 5 | 0 | 231.02 |
| @TCU | 24 | 38 | 344 | 63.2% | 2 | 0 | 156.57 |
| Tulane | 31 | 38 | 419 | 81.6% | 5 | 0 | 217.62 |
| @Penn State | 22 | 39 | 270 | 56.4% | 3 | 1 | 134.82 |
| Indiana | 33 | 44 | 455 | 75.0% | 6 | 2 | 197.77 |
| Minnesota | 33 | 44 | 412 | 75.0% | 3 | 0 | 176.15 |
| @Purdue | 49 | 73 | 470 | 67.1% | 2 | 1 | 127.51 |
| Nebraska | 18 | 32 | 252 | 56.3% | 2 | 1 | 136.78 |
| @Mich State | 24 | 39 | 227 | 61.5% | 1 | 0 | 118.89 |
| Maryland | 28 | 38 | 405 | 73.7% | 4 | 1 | 192.68 |
| Grand Total | 317 | 452 | 3954 | 70.1% | 38 | 7 | 168.26 |
Dwayne Haskins looked more like what we saw early in the season. The pass efficiency rating, which factors completions, TD’s, Yards and Interceptions, was the highest it has been since week six against Indiana. Haskins’ ability to complete a high percentage of his throws and throw the ball down field allowed us to handle the adversity and eventually prevail. Despite the pick six, it was his best performance of the season.
The Playmakers
Who got the ball?
A chance is defined as a carry, a catch, or being targeted on a throw.
| Position | Chances | Pct of Chances | Yards | Pct of Yds | YPP |
| H | 17 | 18.09% | 97 | 14.10% | 5.71 |
| 14 – Hill | 9 | 9.57% | 39 | 5.67% | 4.33 |
| 21 – Campbell | 6 | 6.38% | 46 | 6.69% | 7.67 |
| 30 – McCall | 2 | 2.13% | 12 | 1.74% | 6.00 |
| QB | 16 | 17.02% | 60 | 8.72% | 3.75 |
| 7 – Haskins | 15 | 15.96% | 59 | 8.58% | 3.93 |
| 18 – Martell | 1 | 1.06% | 1 | 0.15% | 1.00 |
| RB | 39 | 41.49% | 205 | 29.80% | 5.26 |
| 2 – Dobbins | 39 | 41.49% | 205 | 29.80% | 5.26 |
| TE | 6 | 6.38% | 55 | 7.99% | 9.17 |
| 13 – Berry | 1 | 1.06% | 11 | 1.60% | 11.00 |
| 89 – Farrell | 5 | 5.32% | 44 | 6.40% | 8.80 |
| WR | 15 | 15.96% | 271 | 39.39% | 18.07 |
| 1 – Dixon | 6 | 6.38% | 102 | 14.83% | 17.00 |
| 9 – Victor | 2 | 2.13% | 41 | 5.96% | 20.50 |
| 83 – McLaurin | 4 | 4.26% | 118 | 17.15% | 29.50 |
| 17 – Olave | 3 | 3.19% | 10 | 1.45% | 3.33 |
| TEAM | 1 | 1.06% | 0 | 0.00% | 0.00 |
| Total | 94 | 100.00% | 688 | 100.00% | 7.32 |
This was the highest quarterback usage of the season.
Looking ahead.
The level of difficulty increases exponentially this week. The team up north comes calling and will pose a significant challenge. Later in the week we’ll take a deeper dive at the numbers and look ahead to the matchup we have been waiting all season to see.


Once again, I think we all miss key points. MD had huge plays and I believed they played 5 paygrades above themselves. OSU’s O seemed unstoppable mid way through the second except with our TO’s. Our D went on a 20 minute stretch when we shut down MD totally. Take away those TO’s and a gifted fumble for them in the endzone accompanied by a poorly played punt as Urban confessed at that time and this game would of been much more in OSU’s favor. Listening to all on this thread, you make good points, but don’t forget NW put 17 on them in the first half as well as IN and they gave up nearly 400 yards to IN. Do we need to be very concerned with the D? Yes, but there are some things there that MI should not overlook as well as us and that should concern MI.
Was there really improvement in the running game, or was it that Maryland, like Ohio State purely SUCKS at rushing defense?
Like coming out of last week I was hopeful that the defensive performance was a real upswing. THAT was fools gold.
So have the Buckeyes actually made any progress in the running game, or, like with MSU, which has a royal crap storm of an offense, were the Buckeyes this week beneficiaries of lousy defense by Maryland? Going back through trends……………the running game, like the defense I suspect is pure fools gold. They’ll have a serious test this week. We’ll see if the offensive line has an ounce of heart, or even a spark of fire and passion.
The refs this season have allowed the whore house in Ann Arbor to get away with more offensive holds, more defensive holds and interference NON calls than any team has been allowed to get away with since the modern era of college football began. THAT will be the determining factor in how the offense looks by the end of the game. If the game is officiated without bias……….the Buckeyes will win. If not, the Buckeyes will lose.
Absolutely correct on the holds..they have gotten away with it all year..which is mind-blowing. If you are notoriously known for that, why in the hell are they still getting away with it.. I hope that in a game of this magnitude, the Refs call it fairly..and you are 100% correct, if we don’t get the calls, we lose..
They couldn’t run against lousy defenses earlier in the season and now they can.
I think the problems were multiple. The offensive line. They have played undisciplined and seemed….and STILL seem to trip over themselves to be the lineman who commits the most penalties. Watch the Maryland game. Michael Jordan is still a bad center. Other than the TCU game this offensive line, even when they get to the second level don’t do more then stand and watch. They have no intention to look for a different helmet to engage. The next problem earlier was that the backs seemed to have lost interest in running because their offensive line got worse before becoming a no show. Next the game plans reflected 100% RPO and stretch plays. How do you get into the game to run downhill when 90% of the time your racing to the sidelines to get away from the defense the offensive is too chicken shit to block? How many times was JK slamming the ball with his own hands, or Mike slamming it to the ground and being visibly “unhappy” because nobody would step up and help them out with blocks? SPOILER ALERT………TOO MANY TIMES. Production decreased the more frustrated they became, and the worse the line got.
It took the staff how long to learn that the make-up of this offensive line just isn’t good before they started correcting the scheme to more drive blocking? Even drive blocking this line isn’t all that good. As a matter of fact, they were better in HS. Are you kidding me? The offensive line has to be REtaught how to drive block and beat the crap out of the defensive line? IF that’s true, I feel VERY vindicated about stating that Greg Studrawa has no business at Ohio State.
With “maybe” a glimmer of hope after the bye week the backs started running hard again. Mike Weber had a serviceable game against MSU, and YAY they ran on Nebraska and Maryland. The best thing you can say about their (Maryland/Nebraska’s) rush defenses, is that they aren’t Rutgers or Oregon State. Nope they really aren’t any better than that clown show the Buckeyes played in Week 1, Oregon State, or, Rutgers in week 2.
Are they really any better when you look at the who’s and how’s?
Rushing totals as the backs progressively get more frustrated.
Game 1 – 375 against Oregon State
Game 2 – 354 against Rutgers
Game 3 – 182 against TCU
Game 4 – 151 against Tulane
Game 5 – 119 against PSU
Game 6 – 154 against Indiana
Game 7 – 92 against Minnesota
Game 8 – 76 against Purdue
I’m sorry but I’m missing your point. They produced against lousy defenses early in the season in the same manner they have against clown shows like Maryland and Nebraska. What those games following Rutgers shows me is a unit of running backs who had quit because of awful play selection, and even worse offensive line blocking.
Nobody expects them to have 350+ yard campaigns against pimples every week, but a trend was obvious. The lazier the offensive line got, the poorer the rushing production got. Maryland and Nebraska are only slightly better pimple size rush defenses than Rutgers and Oregon State. Against a defense with an actual rush defense the Buckeyes still only mustered 120 total rush yards. The second half of the season since the break looks EXACTLY like the first half of the season. What would that 120 yards look like had MSU had even a glimmer of an offense?
Surely you’re not going to argue that the 512 rushing yards against Nebraska and Maryland is better than the 729 rushing yards against Oregon State and Rutgers?
I’m lost on what point it is you’re trying to make.
I’m not sure why you’re lost. They weren’t able to run during the middle of the season against bad defenses. Now they have run against better defenses. Things have improved. Have they improved enough? That’s the only question that matters.
1 better defense….MSU, and they totalled 120 yards against them. Maryland and Nebraska stink as rush defenses. The drop toward the middle of the season was just as much running back frustration as it was offensive line, and play selection. Since the bye week this offense has faced exactly 1 rush defense, MSU. Maryland’s and Nebraska’s are worse than every other opponent on the schedule except Oregon State and Rutgers. The only real difference are the types of rush attempts and blocking scheme. The results are not much different.
I’m looking at the entire body of work. Looks the same as the front half of the season. (shrugs)